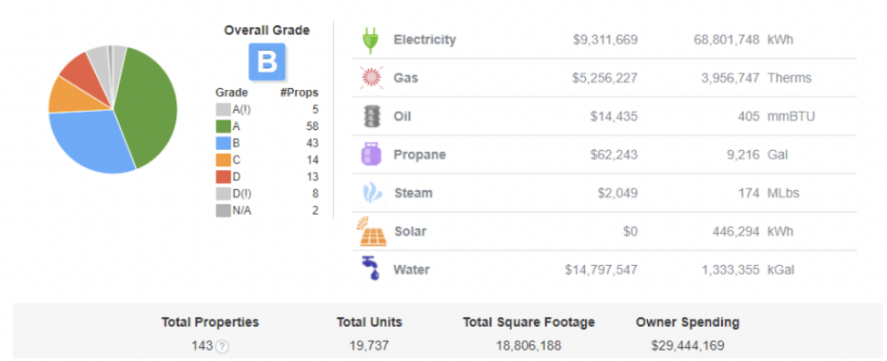
EnergyScoreCards is Bright Power’s premiere utility bill analytics software. In our latest release of EnergyScoreCards, we implemented an update to the weather station data used to generate energy grade metrics. The meteorological dataset used by EnergyScoreCards has been updated to account for climate changes across the country during recent years. The new meteorological dataset has been adopted to better align with standard reference datasets made available by the industry. Overall, this update has minimal impact on EnergyScoreCards grades.
Bright Power experts conducted a comprehensive review to examine the impact updating the dataset has on property EnergyScoreCards grades. Read the full report below.
For more information on EnergyScoreCards’ property grades, visit The Science Behind the Grades.
EnergyScoreCards Update: TMYx Weather Data
Full Report
by Emma Toon and Caleb Smeeth
Background
EnergyScoreCards will now reference the National Centers for Environmental Information’s (NCEI) latest weather dataset known as typical meteorological year (TMYx) in order to calculate owner and whole building energy grades. EnergyScoreCards has historically used TMY3 meteorological data (1991 to 2005) to calculate energy grades, however, the TMYx dataset contains more recent weather data from 1991 to 2020 that accounts for changes in climate across the 170+ weather stations supported.
We conducted a review to determine the impact updating to TMYx will have on property EnergyScoreCards grades. A summary of key findings from our review can be found below:
Findings
How are grades impacted?
At a glance, with the introduction of TMYx data:
- Grades remain largely unchanged across all end uses
- Of the grades that did change:
- Majority changed letters by a factor of 1 (e.g. A to B or B to A)
- Slightly under half improved and slightly over half worsened
- Majority are overall energy grades
Refer to Figures 1 and 2 below to explore this further. Note that both plots are focused on Most Recent Year Owner Scorecards, but similar trends were found amongst all scorecard types.
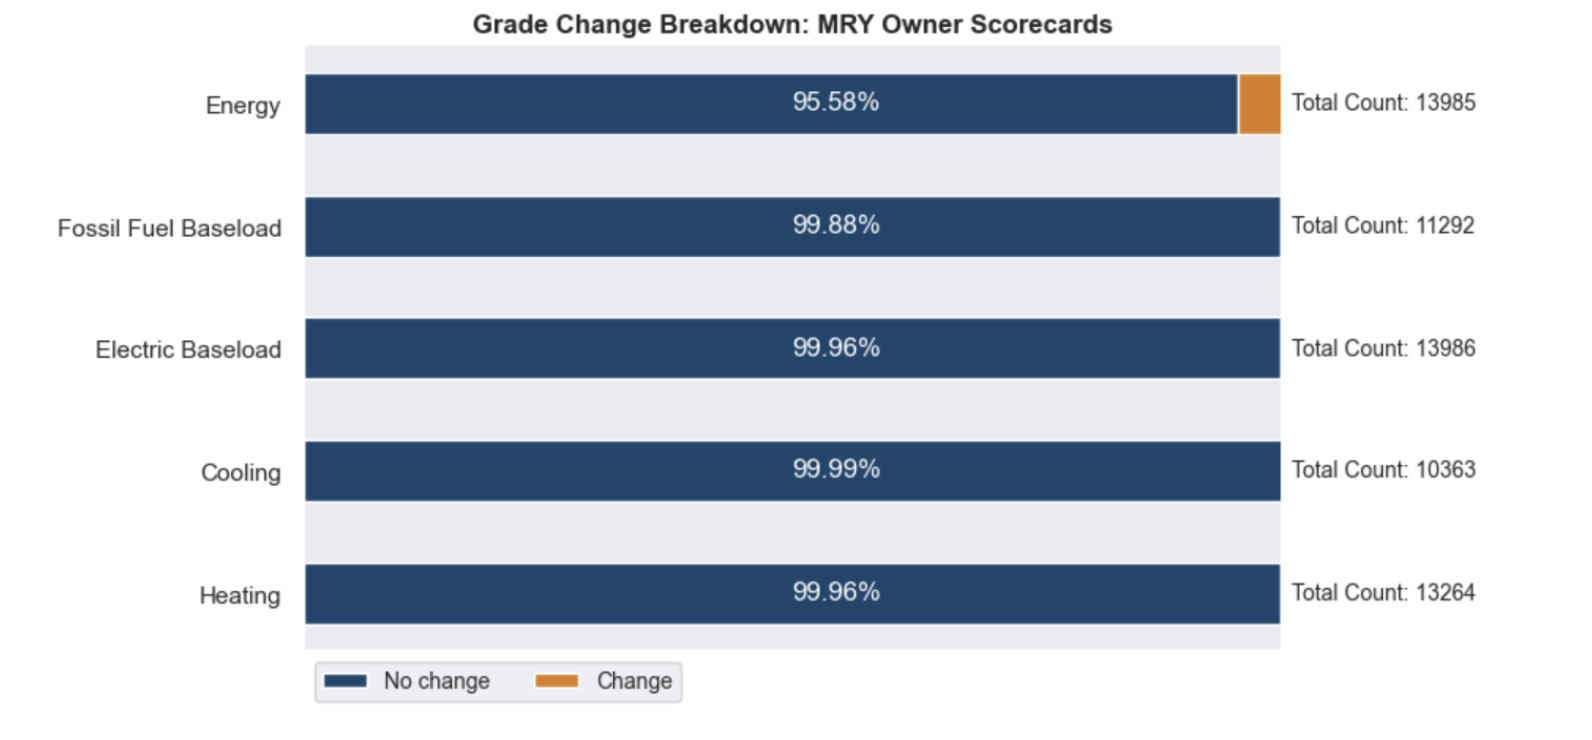
Figure 1: Bar chart showing the percentage of grades that changed by end-use for Most Recent Year Owner Scorecards. All end-uses remain largely unchanged, with overall energy grades changing slightly more.
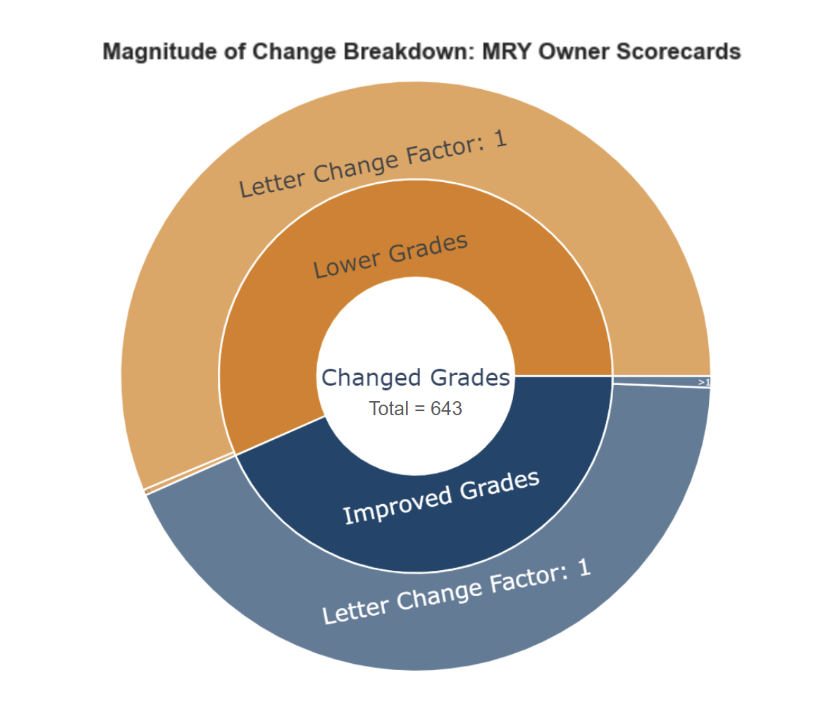
Figure 2: Sunburst plot showing the breakdown of how grades changed for Most Recent Year Owner Scorecards. The first level shows the breakdown of grades that improved vs. grades that worsened. The second level shows the breakdown of change magnitudes. Note that of the grades that changed, the vast majority only changed letters by a factor of 1.
Why are grades impacted?
EnergyScoreCards grades are determined by how much a building’s consumption, or actual end-use index (EUI), differs from the consumption we predict a similar peer building would use, or predicted EUI. The grade reflects whether a property is performing better or worse than expected.
Both actual and predicted EUIs take typical meteorological year data into account, specifically the features heating degree days (HDD) and cooling degree days (CDD). HDD and CDD are metrics designed to quantify the amount of energy needed to heat a building during colder periods and cool a building during warmer periods, respectively, and vary based on location. The climate a building is located in impacts how much energy it uses, making HDD and CDD necessary values to account for during the grading process.
In general, when comparing TMY3 to TMYx, HDDs decreased and CDDs increased, signifying warmer temperatures overall. About 70% of weather stations saw an increase in average annual CDD and 76% of weather stations saw a decrease in average annual HDD. These changes are consistent with what we know about climate change, implying that the TMYx dataset is more representative of climates across the US today. Referencing the updated weather data in TMYx ensures that grades best represent how well a building is performing in its current climate.
How does HDD and CDD impact the grading process?
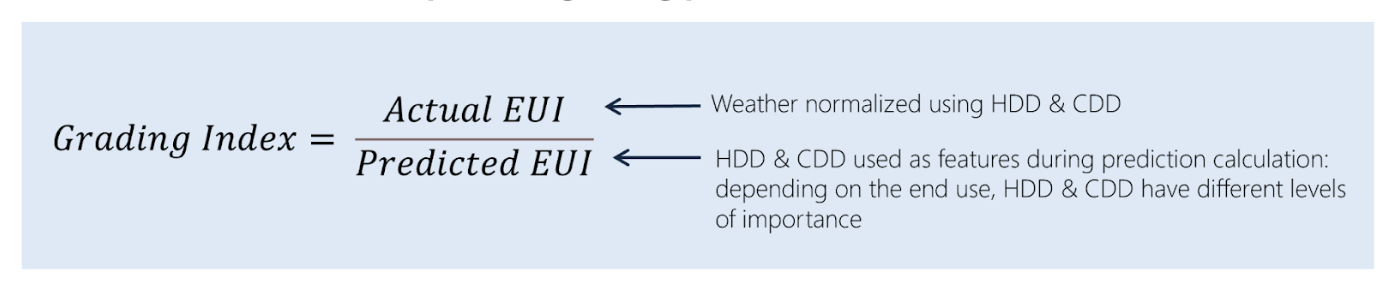
A building’s actual EUI is weather-normalized using HDD and CDD in an effort to minimize any weather abnormalities in a year, giving a more accurate picture of a property’s efficiency. The predicted EUI is calculated using a machine learning model that takes HDD and CDD into account when making predictions. Depending on the end use, HDD and CDD are more or less important for determining how much energy we expect a peer building to use. For example, if a building is in a cooler climate, denoted by a higher HDD, we expect it to use more energy for heating. Thus, HDD has high importance when predicting heating consumption. Conversely, HDD and CDD have little importance when predicting electric and fossil fuel baseload consumptions because they are non-weather dependent. The amount of energy you use to light your building doesn’t depend on the weather. The effects that weather normalization using HDD and CDD have on actual EUI are also dependent on end use for similar reasons.
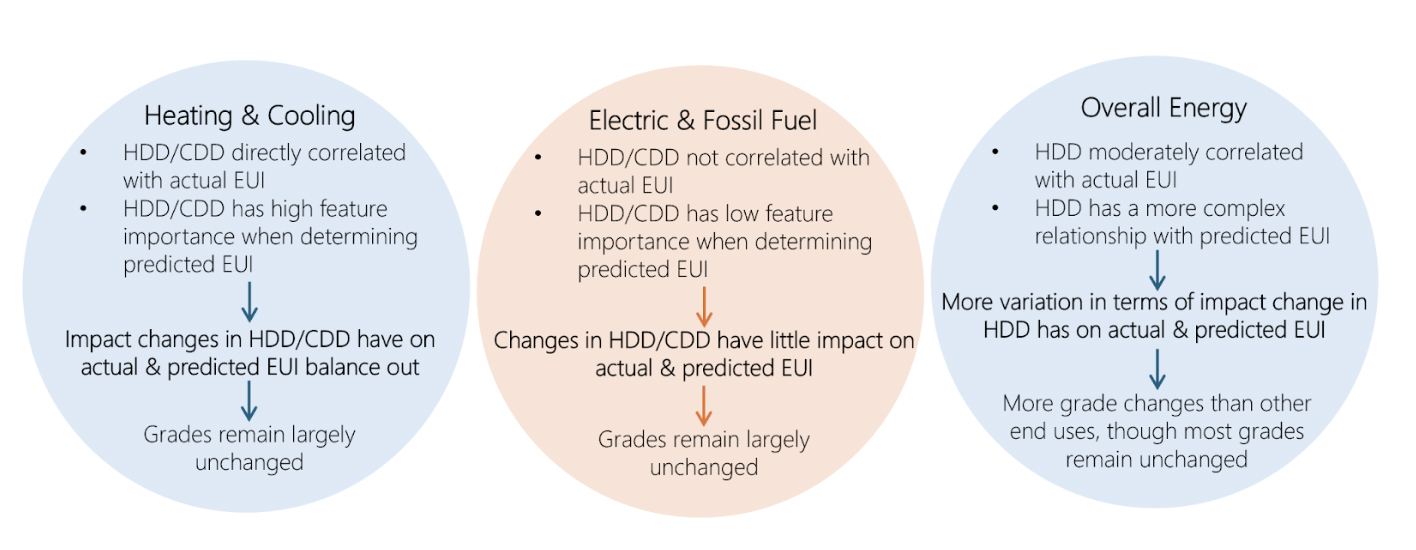
Refer to the chart below for a summary of how referencing the updated HDDs and CDDs in TMYx impacted grades for different end uses. Changes in HDD/CDD refer to the changes between HDD/CDD at each weather station from TMY3 to TMYx.
More detailed information on how grades are calculated can be found here.
Summary
Overall, there is minimal impact on your EnergyScoreCards grades due to this update to the latest TMY iteration. However, since both components used to determine grades are influenced by HDD and CDD to an extent, some changes in grades are inevitable. By referencing the most up-to-date weather data, we ensure grades best reflect your building’s performance.
If you want to review the impact on your specific property portfolio, please contact your Bright Power Energy Analyst.
For questions about EnergyScoreCards, email us here.