September Market Conditions: Winter Weather & Virus Expected to Impact Energy Prices
What to Know, Now
Market Overview: Natural gas prices have begun to increase. This upward price trend is resulting from:
- the spring’s lower prices caused by the mild winter
- the economic slowdown from COVID-19
- reduced natural gas production
- a declining natural gas storage surplus
This is all despite the total amount of natural gas storage for the winter expected to be at near record-high levels. The result of the uptick in natural gas prices this winter will likely also impact winter electric rates.
Natural Gas Storage Levels and Pricing Trends (US EIA)
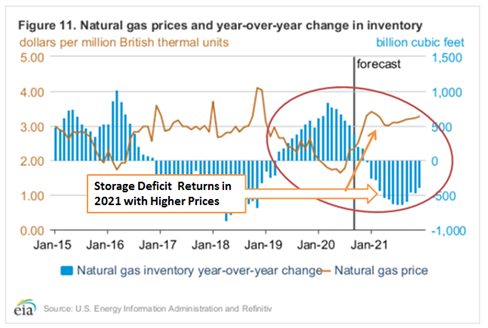
In the chart above, the declining stored natural gas volumes (blue lines) run opposite to the price movement (brown lines) which is forecasted to increase as we approach the winter. This represents the trending downward price pressure. This winter is forecasted to have mostly average to above-average temperatures for most of the country. If this forecast holds true, we could see another low-demand winter like last year, which could result in higher levels of natural gas in storage.
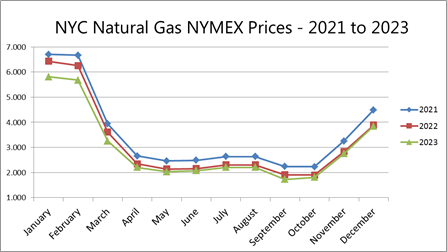
Forward Natural Gas Prices
The table below displays the year-over-year cost change in the current natural gas NYMEX futures prices. In short, 2021 pricing is significantly higher than in 2020 but subsequent years should see continuing price declines. Thus, contracts for 2021 will represent an increase over recent rates, while longer-term agreements (two-and three-year contracts) will capture the lower prices in 2022 and 2023 and result in lower fixed prices.
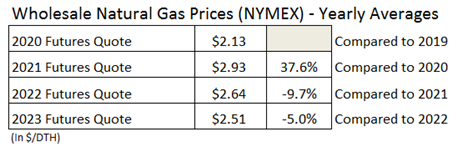
Stored natural gas is currently at surplus levels with declining production still slightly outpacing demand. The summer’s hot weather challenged the market with high AC/electricity demand and increases in prices in the near term twelve-month period. The largest price increases have been in September, October, November, with the rest of the year increasing to a lesser extent. The Natural Gas Wholesale NYMEX Prices table below shows the pricing trend from 2019 to 2022, with lower rates in 2020 and increasing costs into 2021.
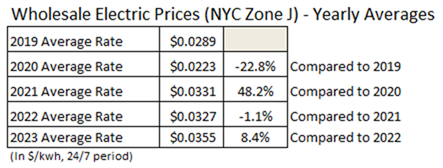
Electricity
Since the price of electricity generally moves with the price of natural gas, the two prices have similar trends. Electric rates are fairly low but have seen increases during the summer heat and in anticipation of this winter. The lower rates in 2020 are now 48% below the 2021 prices. Weighted electric supply rates from ConEd will likely be in the $0.08/KWH to $0.11/KWH range this fall. Price trends vary from state to state, but generally, prices are increasing each calendar year.
The Bottom Line
The current pricing trend creates higher fixed price rates for the longer term (two- and three-year) electric contracts. Twelve-month contracts may have the lowest fixed rates. Natural gas will have lower rates with longer two or three-year terms.
Winter focused heating accounts will see a slight cost reduction in 2020, while accounts with steady year-round demand (such as heat and hot water accounts) may see lower costs this summer and more favorable fixed contract rates. If you rely on fixed-price contracts to control budgeted costs, this is an excellent time to review the impact of your next contract.
Longer-term fixed-price contracts are currently at higher rates than shorter-term ones but offer price stability during volatile periods such as this summer and next winter. Since energy costs vary in each state it is best to validate any savings opportunities with refreshed pricing on your next supply agreement.
Not sure what your options are or how to proceed? Bright Power can help.
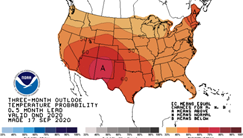
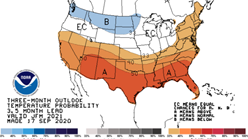
Temperature Probability Maps
Current temperature forecasts for the remainder of this year and this winter are calling for above-average temperatures for most of the U.S. These forecasts may offer support to counter the expected decline in storage levels and may assist in keeping prices from spiking this winter.